Reports: see how your team is doing
Twelve reports are already built, so there is nothing to set up. Pick the dates, the team and the way people wrote in. Then build your own, keep it as a dashboard, have it emailed every week, or download it as a spreadsheet.
Twelve reports, ready to run
Each one has a plain name and the name your last system probably used. Both are below.
- How many requests came in and were closedTicket volume, over any date range
- How fast you replied the first timeFirst response time: the average, the middle, the slowest tenth, and how many came back again
- How long a request took to fixResolution time, with the same averages beside it
- How often you kept your promised timesYour reply and fix promises: how many you met
- How each team member is doingSolved count, replies, first reply time, rating, and time online, away and busy
- What customers scored youThe score, the spread, how many answered, and the low ratings to follow up
- Which way people wrote inShare of requests by email, chat, phone and the rest, with the first reply time for each
- What is piling up, and how old it isOpen requests by age and by status
- Time logged on requestsTime accounting: the hours your team recorded against work
- How your own fields are being answeredWhich product, reason or model comes up most, from the fields you added
- Which saved replies get usedSo you can tidy up the ones nobody picks
- How long a request sits at each stepTime in status, and which open requests are stuck longest
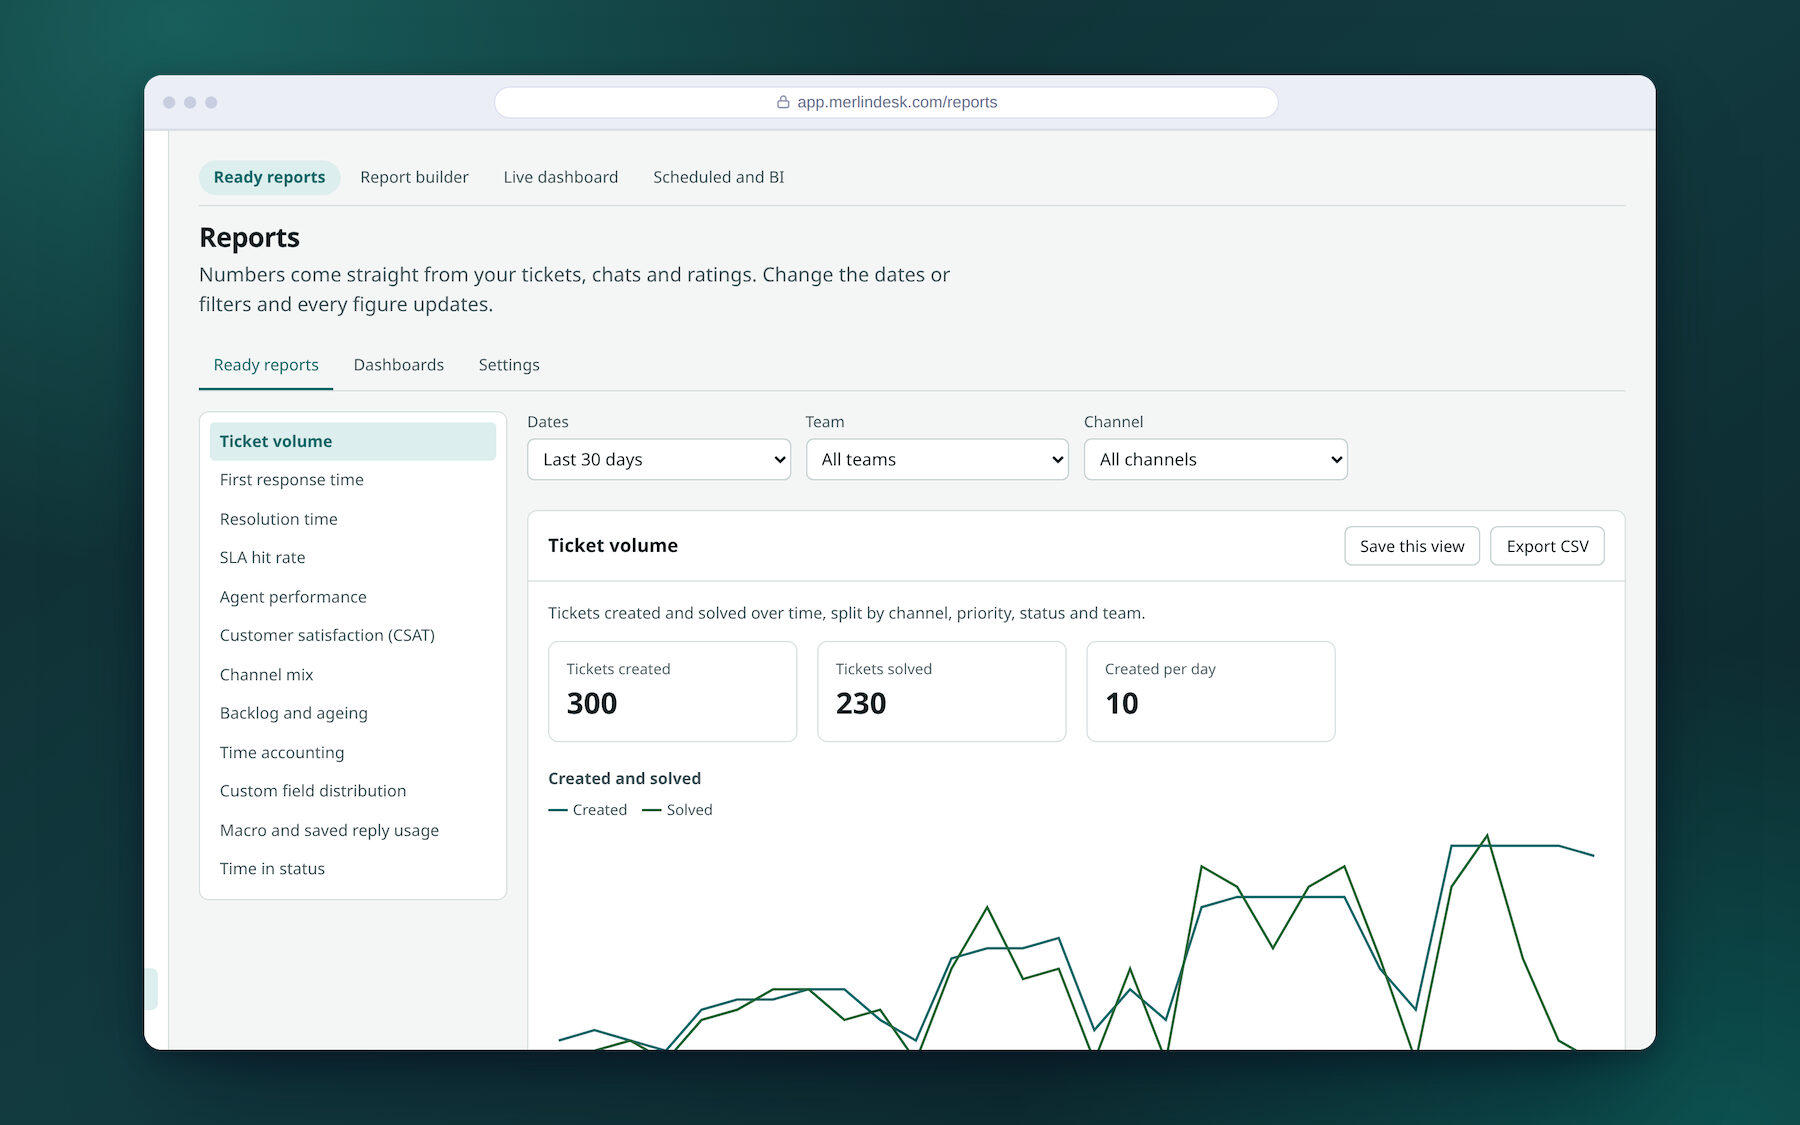
- Filter every one the same wayA date range, a team and a channel
- Save a report with its filters under a nameSo you open it the same way next time
- Set the default date range, the day the week starts and the time zone
- The main numbers on a manager's phoneIn the phone app, without opening a laptop
Build your own report
Pick what you want counted, pick how to group it, and run it. No one needs to write code.
- Up to eight numbers, grouped by up to three thingsThen filter it and run it
- Six sets of data to start fromRequests, messages and templates, promised times, ratings, chats, and the time staff spent in each state
- More sets when you use those partsHelp page views and searches, bot activity, messages you sent first, money linked to requests, the record of who did what, faults, alerts, changes, problems, equipment and quality reviews
- Eleven ways to filterIs, is one of, contains, more than, less than, is empty, is filled and so on
- Twelve ways to show itTable, big number, bars, stacked bars, line, area, donut, pie, heat map, funnel, scatter or gauge
- Compare with the period beforeThis month against last month, in the same report
- Click a number to narrow the reportIt narrows the figures. It does not open the requests behind them.
- Your own numbers, written as a formulaCounted, percent, minutes, days, a score or money
- About 65 built-in numbers, each explainedSo two people do not mean different things by the same word
- Bring in a spreadsheet as dataAdd to it or replace it later
- Save a set of filters and reuse it
- Type a question in plain wordsIt fills in a report for you. It matches words to reports; it is not AI.
- Download it as a spreadsheet, a PDF or a web pageCSV and Excel too. The PDF is a plain table, not charts.
Save it as a dashboard
A dashboard is a set of reports on one screen, with one set of dates.
- Six dashboards already madeHow support is going, first reply, time to fix, promises kept, the team, and ratings
- Your own, kept to yourself or shared with everyone
- Copy a ready-made one and change itEasier than starting from nothing
- Up to 24 tiles on one dashboardEach tile is a report shown as a big number, a line, bars, a donut or a table
- Change the dates, team or channel onceEvery tile runs again
- Refresh every 30 seconds for a screen on the wall
- Rename it, share it, or delete it
Have it emailed, or take it away
- Email a saved report on a scheduleAs a spreadsheet, a PDF or a web page. Sending needs your own email provider, so it is off on the demo.
- See when each one last went and when it goes nextIncluding anything that failed. Send one now, pause it, or remove it.
- Only to addresses you allowYou list the email domains a report may be sent to
- Share a report by link, with no sign-inLive numbers or a frozen copy, for 1 to 90 days, and you can cancel the link. The link is a data address, not a page in the app.
- Download a big report in the backgroundYou see the row count first, then get a link that lasts seven days
- Send the data to your own reporting toolDaily or weekly. As set up here it writes the files to a folder on the server; sending them to Amazon, Google or Azure storage needs your own account there.
- A read-only account for that toolWith a list of allowed addresses and an hourly limit. It answers over the web, not as a database login.
Live numbers, for today rather than last month
- Twelve live numbers, refreshed every 15 secondsOpen, nobody assigned, about to miss a promised time, already missed, missed today, started today, solved today, the longest open request, chats waiting, chats being handled, the longest chat wait, and staff online
- Live lists beside themOpen requests by status, and who is on now with how long they have been in that state
- Tell someone when a number crosses a lineWith a gap between repeats, a margin so it does not flick on and off, a test button, and a history
- A wall screen you arrange yourselfChoose the tiles, the order, the width and the refresh rate, and hide staff names if you prefer
- A TV link that needs no sign-inIt opens dark for a big screen. You can cancel the link, switch TV links off for the whole account, and the admins are told if one is opened from a new place.
- The last seven days of any data setA quick look without building a report
Who sees what, and how long it is kept
- Limit what a role may report onSome people see the whole account, some see only their own team's data sets
- Figures kept for 25 months by defaultOlder rows are then deleted
- Erase a customer and they go from the figures tooPart of the same deletion request
- Date ranges up to 800 daysWorked out in the time zone you choose
- A health page for the reporting systemSo you can see it is keeping up
Being straight about the reporting. It counts what happened. It does not forecast, predict, or claim to spot an odd pattern by itself — there is no such feature, and we would rather say so than let you assume it.
The figures are worked out by the system's own database. There is a second engine in the code for very large volumes, which is not switched on in this hosting, so the deeper warehouse reports are not available here. Emailing a report, and pushing data to cloud storage, both need your own provider account.